semester
KG2
lecturer
Prof. Andreas Pollok
team
Emelie Gannert
Mitra Ashgari
tools
Webflow
Adobe Illustrator
Apollo-Missions
In the course “Programmed Design 2”, we had to find ways to make complex relationships understandable in vivid visualizations. The task was to present a timetable using shapes and colors and to present the final result interactively and animated on a website.
My project partners and I decided to illustrate the chronological order of eleven Apollo missions. To us, the journey to the Moon appeared to be a crucial step in human history to which we owe many important technologies and inventions. In our data visualization, we showed how long the flights lasted, how often the moon was orbited, how much weight was collected on the moonstone, how many astronauts were on the crew, and how much budget was available for each mission. We obtained the necessary facts from a specially compiled data set.
We chose a design consisting solely of basic shapes, without any alphanumeric shapes.
Combining the exact illustration and visual coding of the individual parameters in a coherent overall composition proved to be difficult during the implementation.
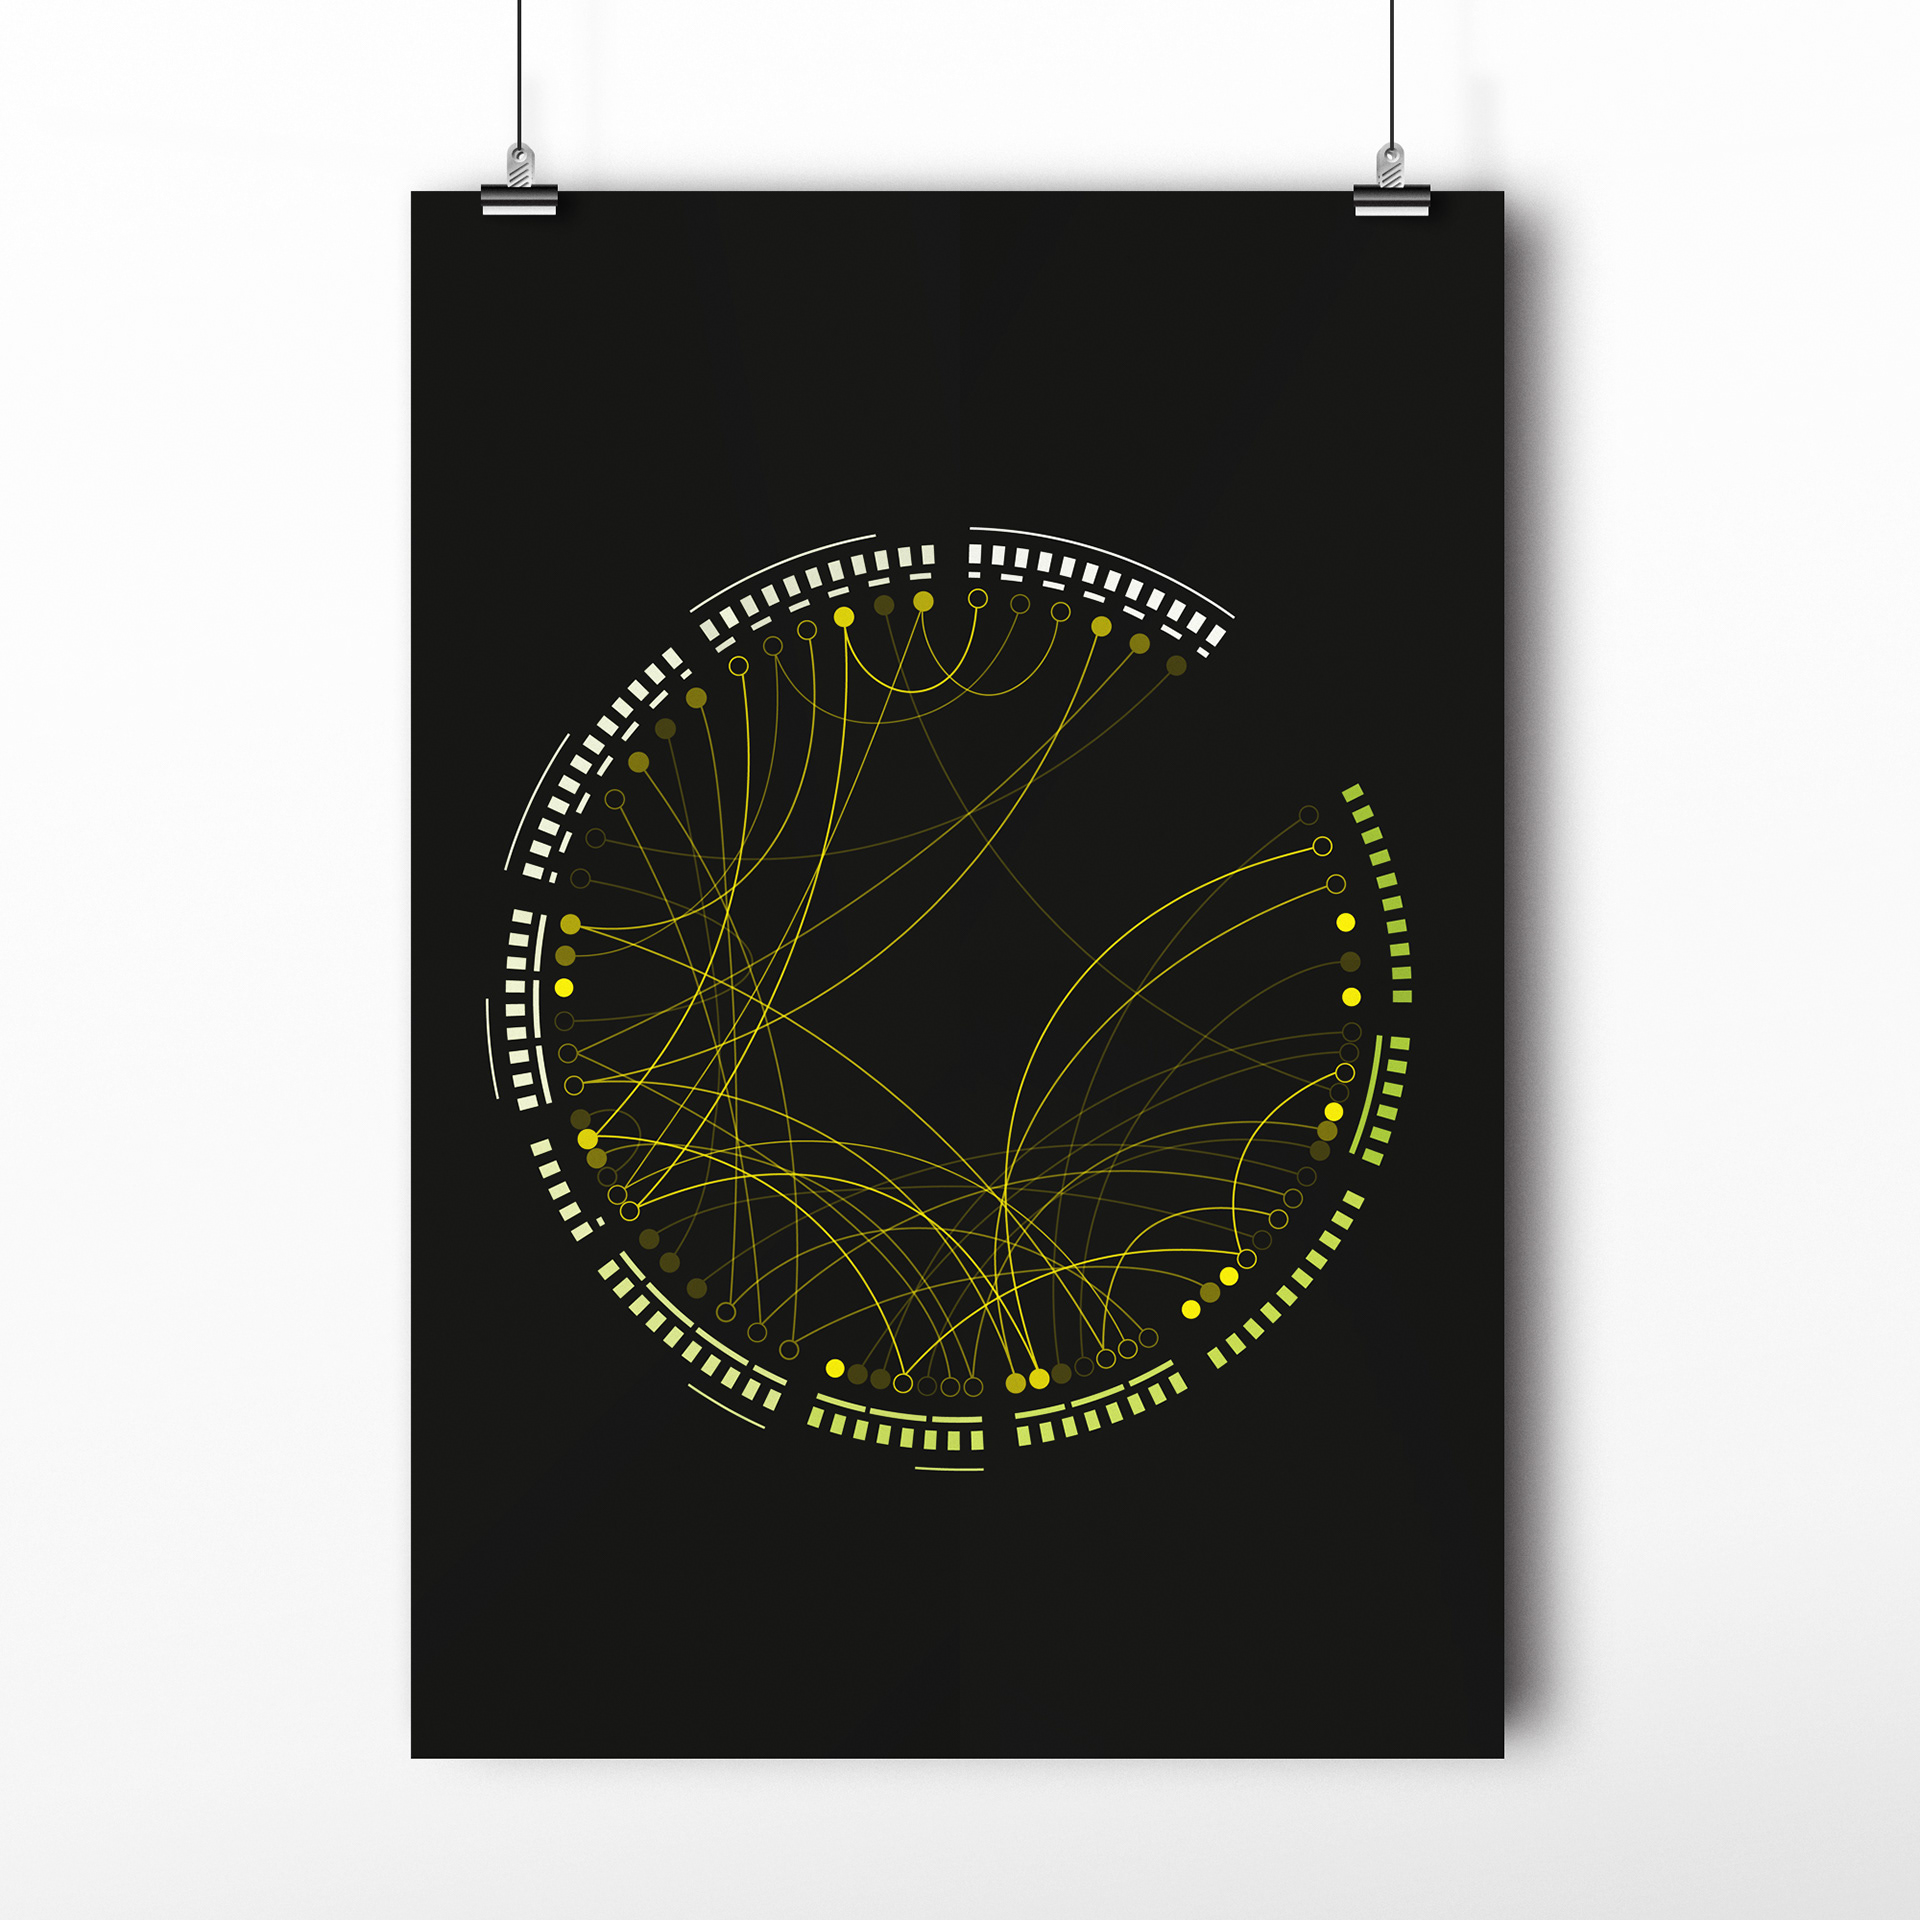
Due to the association with the Moon, Planets and Space, we decided to have a radial representation of the missions in chronological order. The visualization is colored in a strong light green and a bright money to create a clear contrast on the black background. The gradations of the individual missions from dark to light are thus clearly visible.
The Apollo missions 7 to 17 are shown. Thus, the connected circle is divided into eleven sections. You can read the visualization clockwise and starts at Apollo 7 on the right side.
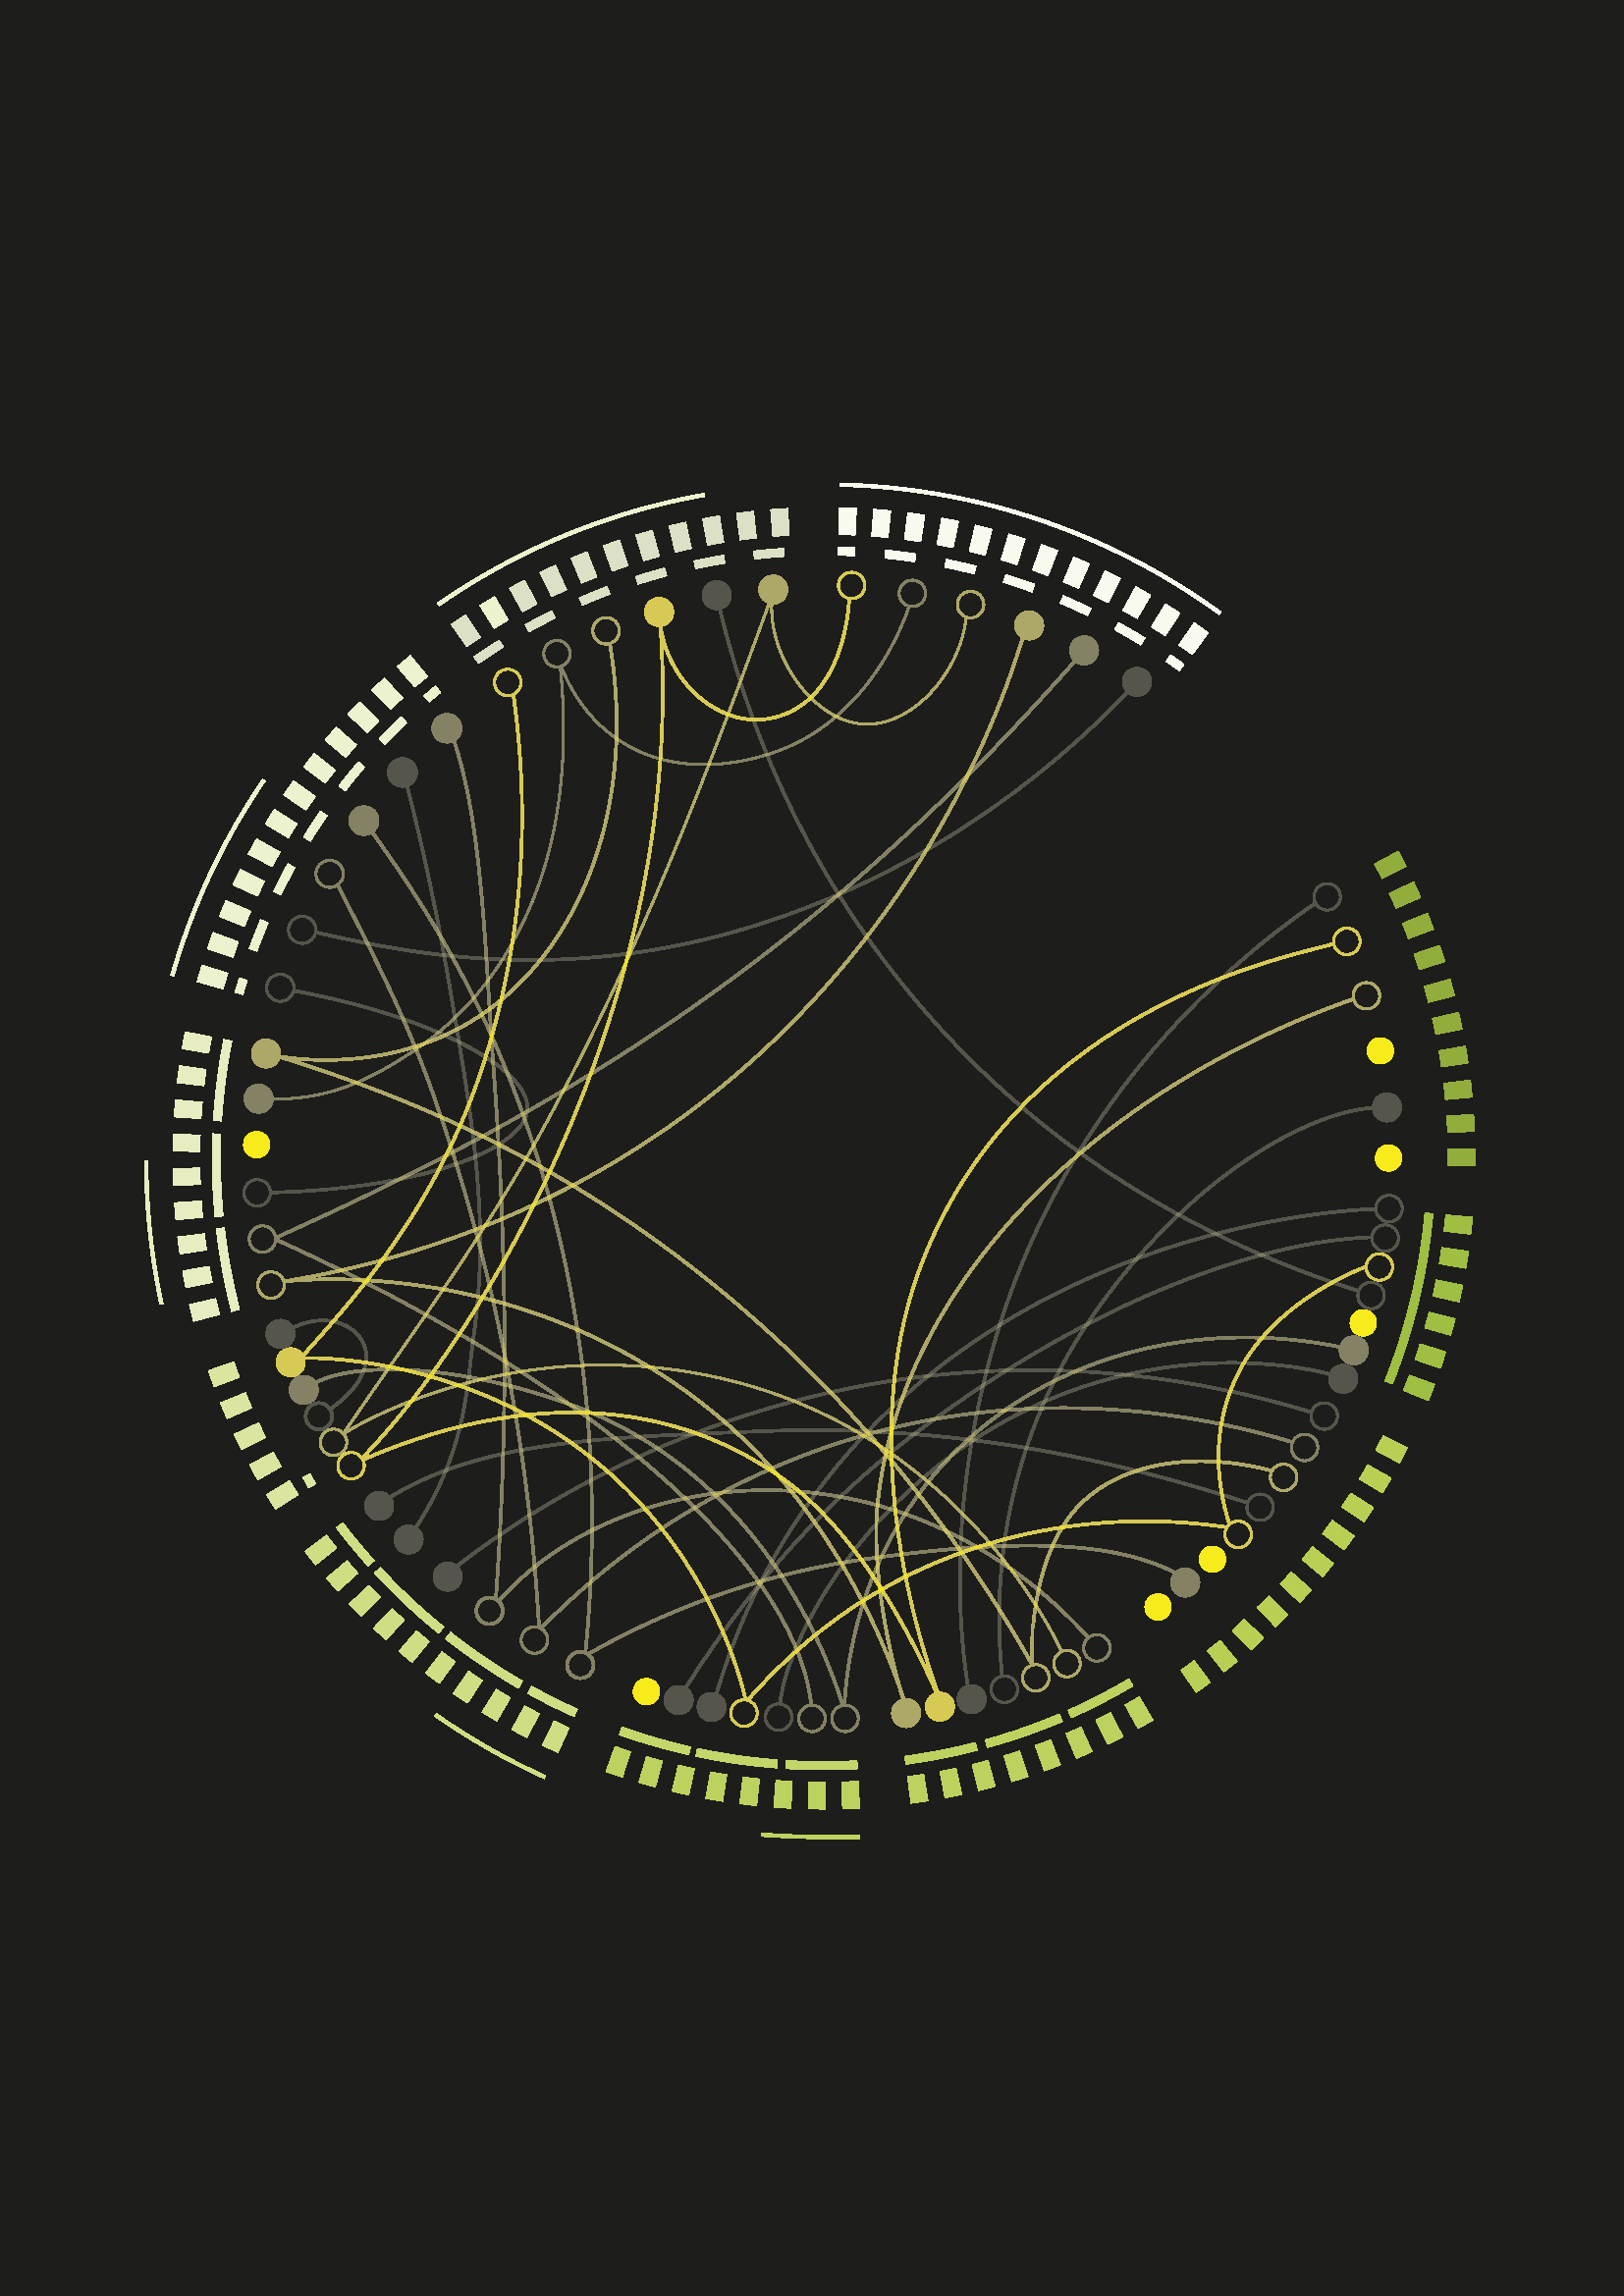
Parameters:
Budget: The brighter the missions, the higher the budget
Crew: Internally coloured circles
Supporting crew: Internally unfulfilled circles
Participation: The lines in the middle connect astronauts who have been involved in several missions. The circles representing the respective crew member are connected.
Participation Frequency: The opacity shows how often an astronaut has participated in a mission. The higher the opacity of the line, the more often they participated. However, the astronauts who have participated only once are marked with the highest opacity. (One Mission = 100%, two missions = 20%, three missions = 40%, four missions = 60%, five missions = 80%)
Moon orbits: horizontal strokes above the circles (One stroke = ten orbits of the Moon)
Flight duration: vertical rectangles over the lunar orbit (one rectangle = one day)
Weight collected in moonstones: Outer thin lines. Collected only from Apollo 11, since before that, the lunar landings were unsuccessful. (The longer the stroke, the greater the weight of the moonstone. The last listed mission, Apollo 17, has collected the most with 110kg = 100%)
the final website